1/5


IELTS writing
1K+Muat turun
4MBSaiz
4.0(13-11-2016)Versi terkini
ButiranUlasanVersiMaklumat
1/5

Perihal IELTS writing
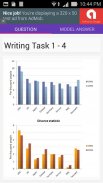
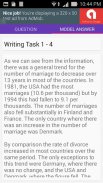
you are expected to write a short descriptive report based on visual information or data. This visual information is most commonly presented as line and bar graphs, pie charts or tables.
You might be asked to describe two graphs or charts. If this is the case, you need to compare and contrast the information and make connections between the two.
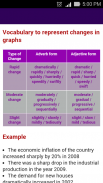
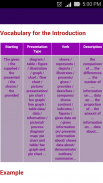
Vocabulary for IELTSwriting task 1
IELTS writing task 1
IELTS writing task 2</br></br></br>
IELTS writing - Maklumat APK
Versi APK: 4.0Pakej: com.vinhtq.ieltswritingtask1Nama: IELTS writingSaiz: 4 MBMuat turun: 89Versi : 4.0Tarikh Diterbitkan: 2017-04-05 17:23:43Skrin Min: SMALLCPU yang disokong:
ID Pakej: com.vinhtq.ieltswritingtask1Tandatangan SHA1: 0A:6C:E5:71:67:F0:73:BE:01:CE:7B:8E:D9:6C:47:79:6F:72:1B:DCPemaju (CN): Vinh TranOrganisasi (O): uitLokasi (L): Vinh LongNegara (C): VNNegeri/Bandar (ST): Vinh LongID Pakej: com.vinhtq.ieltswritingtask1Tandatangan SHA1: 0A:6C:E5:71:67:F0:73:BE:01:CE:7B:8E:D9:6C:47:79:6F:72:1B:DCPemaju (CN): Vinh TranOrganisasi (O): uitLokasi (L): Vinh LongNegara (C): VNNegeri/Bandar (ST): Vinh Long
Versi Terkini IELTS writing
4.0
13/11/201689 muat turun4 MB Saiz


